Technical Analysis for Beginners: 5 Chart Patterns Every Quotex Trader Needs
Master the 5 essential chart patterns that separate winning traders from the rest. Learn support & resistance, candlestick reversals, moving average crossovers, RSI divergence, and trend lines for Quotex.
Technical analysis is the backbone of every successful binary options trader. While it might sound intimidating, the core concepts are surprisingly simple. Master these 5 essential chart patterns and you'll already be ahead of 80% of traders on Quotex.
What is Technical Analysis?
Technical analysis is the study of price charts and patterns to predict future price movements. Unlike fundamental analysis (which looks at news and economic data), technical analysis focuses purely on what the chart is telling you.
Why It Works for Binary Options
Binary options have short expiry times (1-5 minutes on Quotex). Fundamental analysis can't predict 60-second moves — but chart patterns absolutely can. That's why technical analysis is the #1 skill you need.
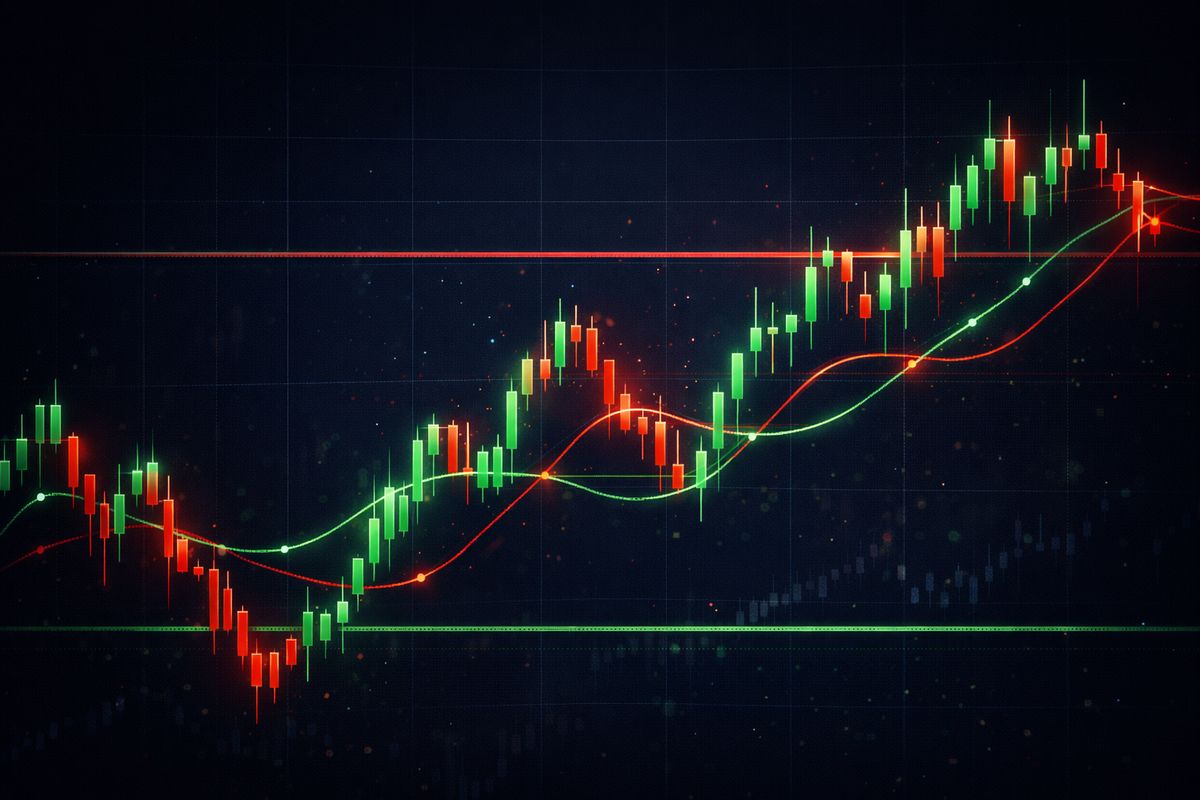
Pattern 1: Support & Resistance
Support is a price level where buyers consistently step in, preventing the price from falling further. Resistance is the opposite — a ceiling where sellers dominate.
Pro Tip
The more times a support or resistance level is tested, the stronger it becomes. A level tested 3+ times is considered very reliable.
Pattern 2: Candlestick Reversals
Candlestick patterns are the bread and butter of short-term trading. Here are the three most reliable reversal patterns:
Hammer / Inverted Hammer: A small body with a long lower wick (hammer) or upper wick (inverted hammer). These signal a potential reversal from a downtrend to an uptrend.
Engulfing Pattern: When a candle completely engulfs the previous candle. A bullish engulfing (green engulfs red) at support = strong BUY signal.
Doji: A candle where the open and close are nearly equal, creating a cross shape. This signals market indecision and often precedes a reversal.
Pattern 3: Moving Average Crossovers
Set up two moving averages on your Quotex chart: a fast one (EMA 9) and a slow one (EMA 21). When the fast MA crosses above the slow MA, it's a BUY signal. When it crosses below, it's a SELL signal.
Pattern 4: RSI Divergence
The Relative Strength Index (RSI) measures whether an asset is overbought or oversold:
- RSI above 70 = Overbought, potential SELL signal
- RSI below 30 = Oversold, potential BUY signal
- RSI divergence = Price makes new high but RSI does not, reversal coming
QuotexKing Signal Generator
Our AI Signal Generator uses RSI, moving averages, and 12+ other indicators to give you instant BUY/SELL signals. Available to all premium members.
Pattern 5: Trend Lines & Channels
Draw a line connecting at least 2 swing lows (uptrend) or swing highs (downtrend). Price tends to bounce off these trend lines, giving you highly predictable entry points.
A channel is created when you draw parallel lines along both the highs and lows. Trade bounces within the channel: buy at the bottom, sell at the top.
Putting It All Together
The Winning Combination
Never trade on a single signal. The best trades happen when multiple patterns align: price at support + bullish engulfing candle + RSI below 30 = high-probability BUY. This is exactly how QuotexKing signals work: we combine multiple confirmations before sending you a trade.
Start with these 5 patterns, practice on a demo account, and you will develop the chart-reading skills that separate profitable traders from the rest.
Related Articles

Trading Psychology: How to Stop Letting Emotions Destroy Your Profits

5 Money Management Rules Every Binary Options Trader Must Follow

Auto Copy Trading: Set It and Forget It

How to Use the QuotexKing Signal Generator: Step-by-Step